


Part 2
In Part 2, of this 2-part blog, we will deploy Prometheus and Grafana.
In Part 1 of this blog, we deployed all the metrics necessary for Prometheus to get the information about the pods, services, namespaces, node hardware, etc.
Let’s dive in and deploy Prometheus and monitor the Kubernetes cluster using Grafana dashboards.
Step 1: Deploy Prometheus
All the deployment files for Prometheus are located in the “monitoring” directory.
$ kubectl create -f prometheus
This creates the Prometheus pod, services and deployment. Prometheus gets deployed in the “monitoring” Namespace.
Note: We have exposed Prometheus service on port 32300
To access the Prometheus through a web browser, use the below syntax:
HTTP://<public-ip-of-worker-node>:<32300>
Below is a screenshot of Prometheus in a browser.
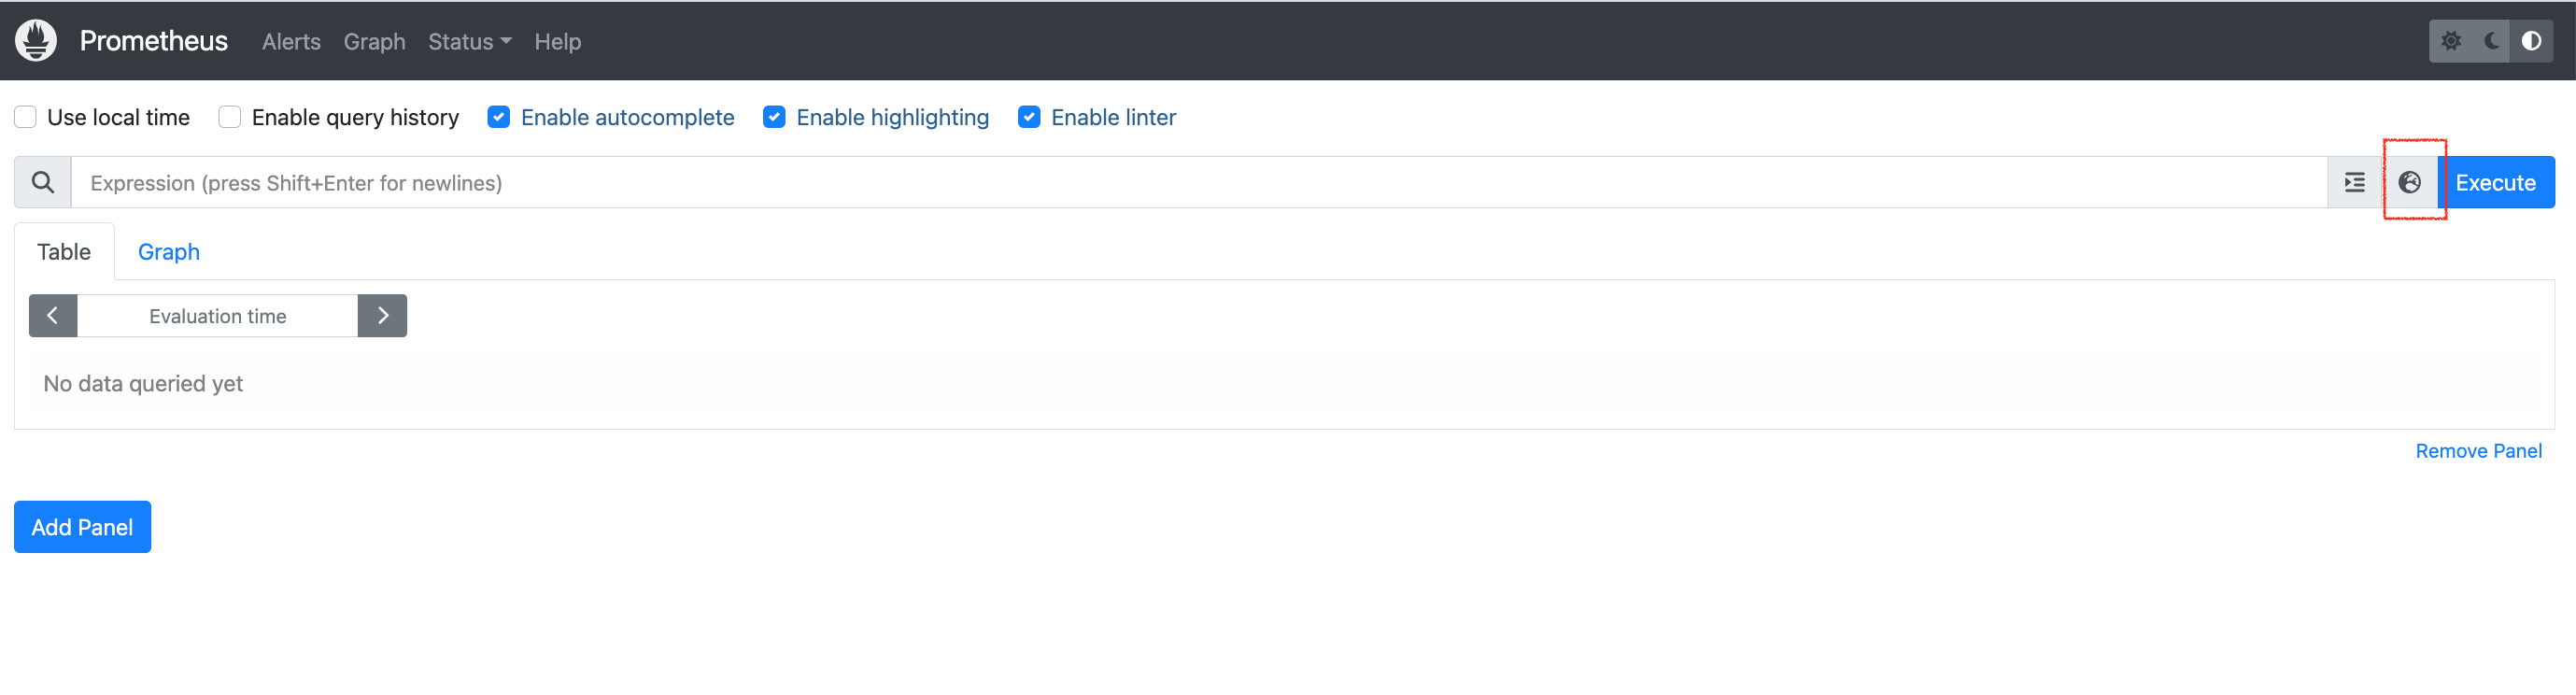
Click on the box (marked in red), which will give a list of query that you can execute and see the results.
We have executed a “kube_pod_info” query which gives the below output:
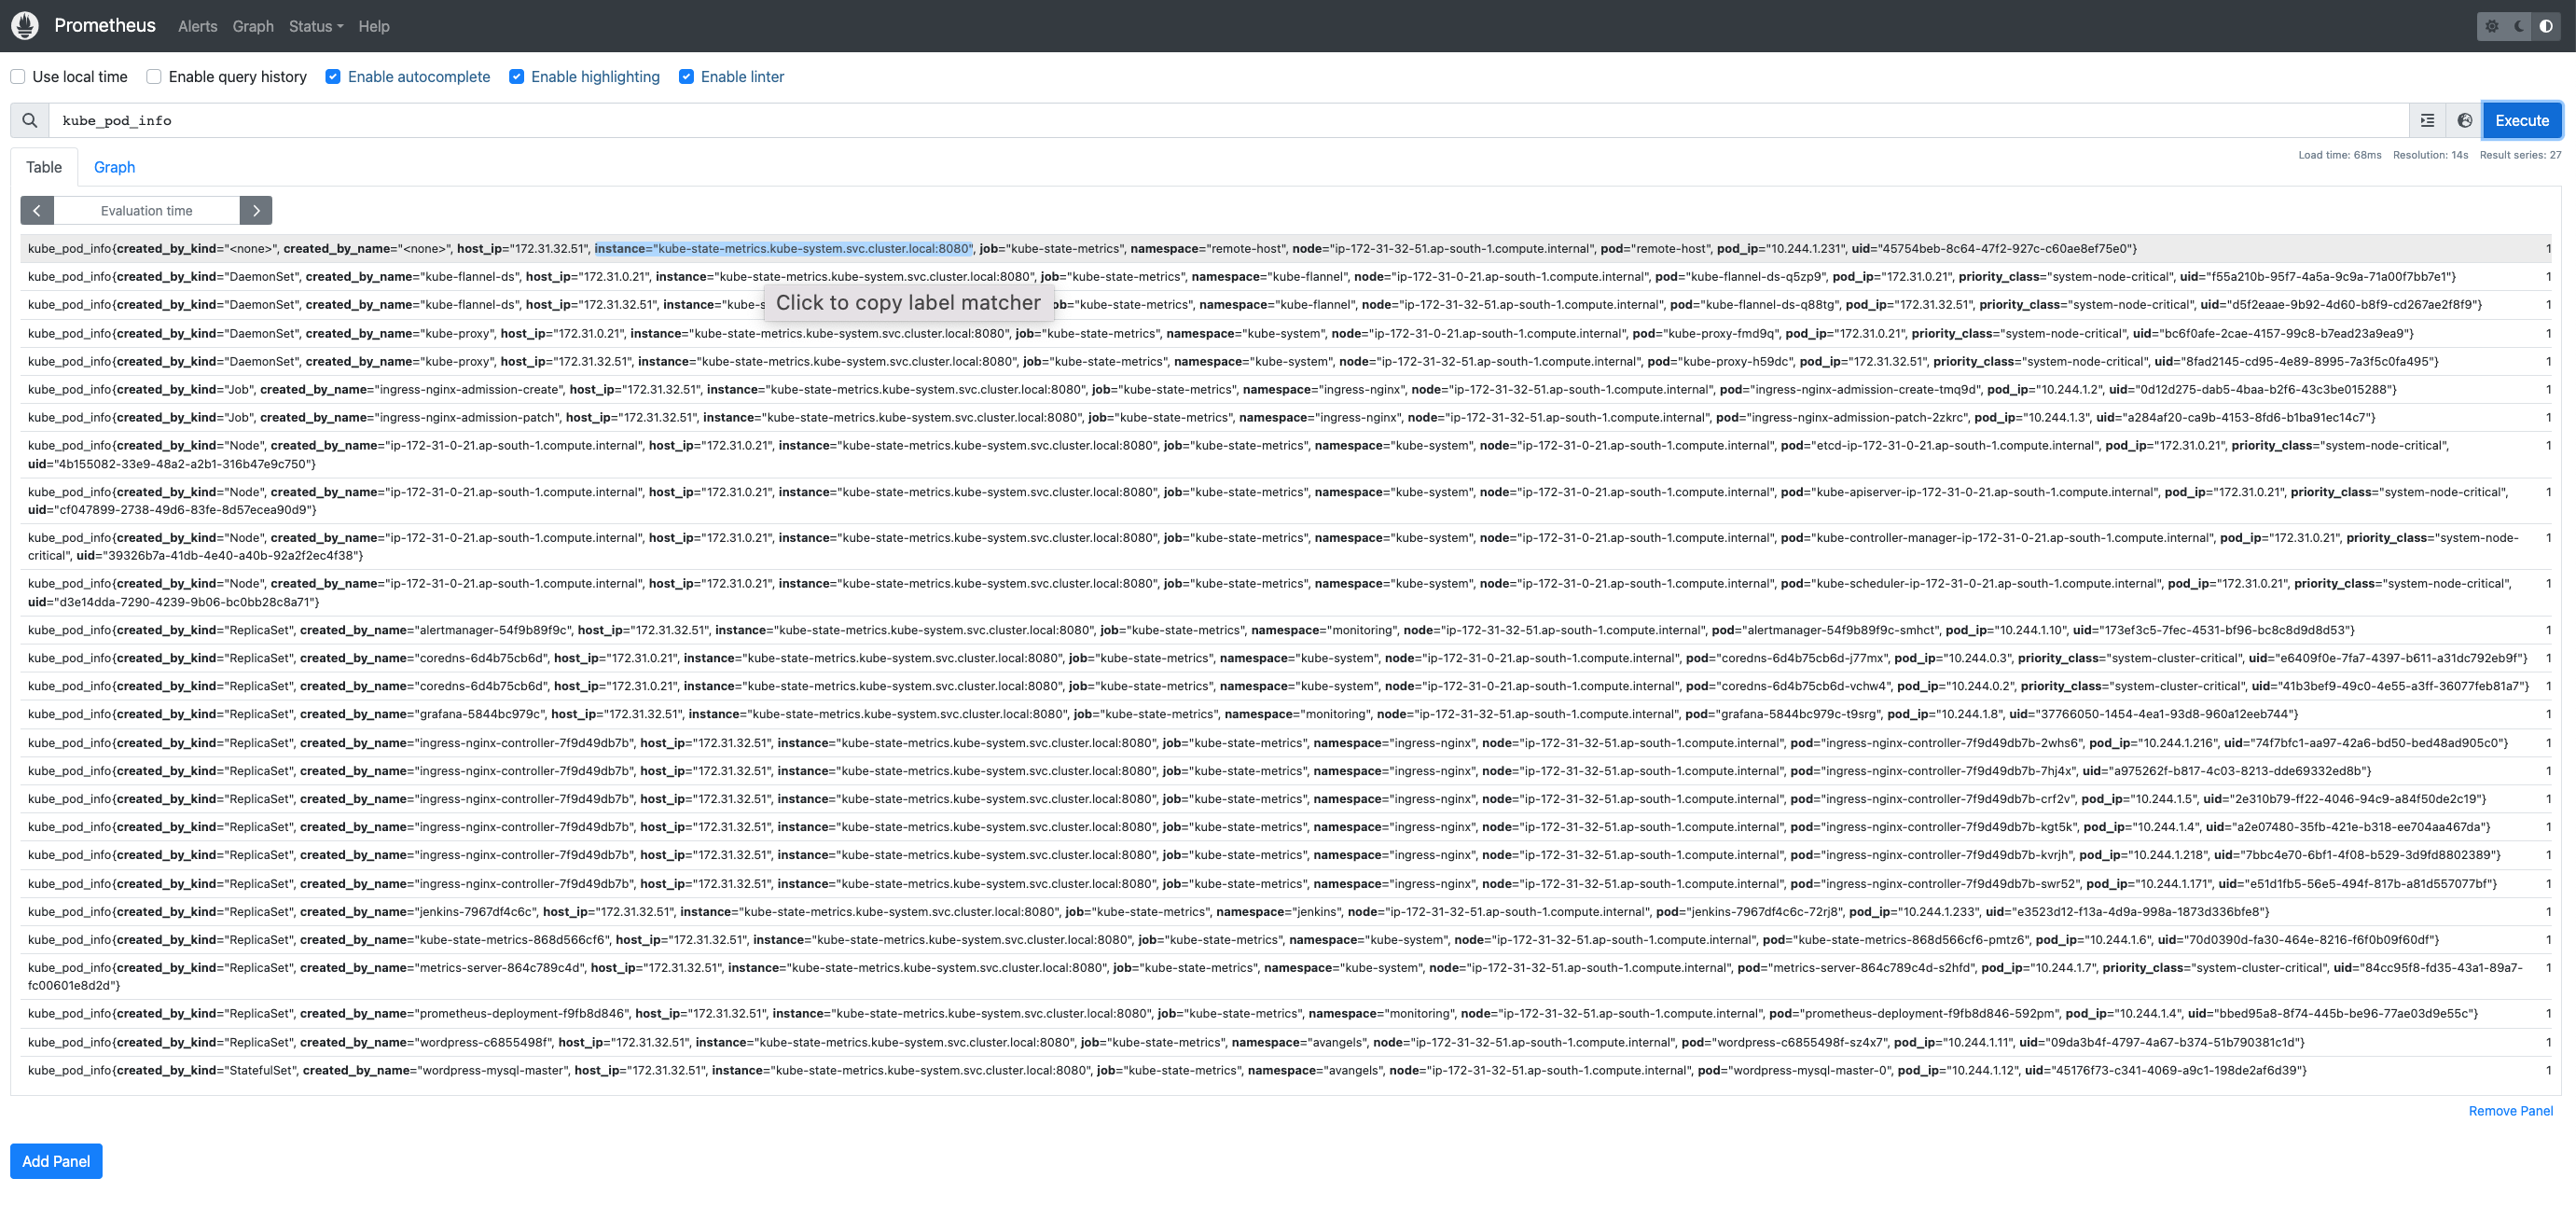
You can select the appropriate query and execute it.
As you can see, the output is not graphical and requires thorough reading to understand exactly what is deployed and if any pods/deployments have failed.
This is where Grafana comes in !!! Grafana provides a visual and graphical interpretation of the metrics data. Using Grafana dashboards we can monitor the status and health of the Kubernetes cluster.
Step 2: Deploy Grafana
The Grafana deployment files are in the monitoring directory.
$ kubectl create -f grafana/
This creates the Grafana pod, services and deployment. Grafana gets deployed in the “monitoring” Namespace.
Now if we query the “monitoring” namespace, we should get the below output:
$ kubectl get all -n monitoring
NAME READY STATUS RESTARTS AGEpod/alertmanager-54f9b89f9c-smhct 1/1 Running 0 28h
pod/grafana-5844bc979c-t9srg 1/1 Running 0 2d1h
pod/prometheus-deployment-f9fb8d846-592pm 1/1 Running 0 2d1h
NAME TYPE CLUSTER-IP EXTERNAL-IP PORT(S) AGEservice/alertmanager NodePort 10.96.109.24 <none> 9093:31000/TCP 28h
service/grafana NodePort 10.105.161.41 <none> 3000:32500/TCP 2d1h
service/prometheus-service NodePort 10.107.155.121 <none> 8080:32300/TCP 2d1h
NAME READY UP-TO-DATE AVAILABLE AGEdeployment.apps/alertmanager 1/1 1 1 28h
deployment.apps/grafana 1/1 1 1 2d1h
deployment.apps/prometheus-deployment 1/1 1 1 2d1h
NAME DESIRED CURRENT READY AGE
replicaset.apps/alertmanager-54f9b89f9c 1 1 1 28h
replicaset.apps/grafana-5844bc979c 1 1 1 2d1h
replicaset.apps/prometheus-deployment-f9fb8d846 1 1 1 2d1h
As you can see Alert-manager, Prometheus and Grafana are running in the “monitoring” namespace. “kube-metrics” and “metrics-server” are running in the “kube-system” namespace.
To query the “kube-system” namespace to check if “kube-state-metrics” and “metrics-server” are deployed, use the below command:
$ kubectl get all -n kube-system
Note: We have exposed Grafana service on port 32500
To access Grafana through a web browser, use the below syntax:
HTTP://<public-ip-of-worker-node>:<32500>
Below is a screenshot of the Grafana login screen in a browser.
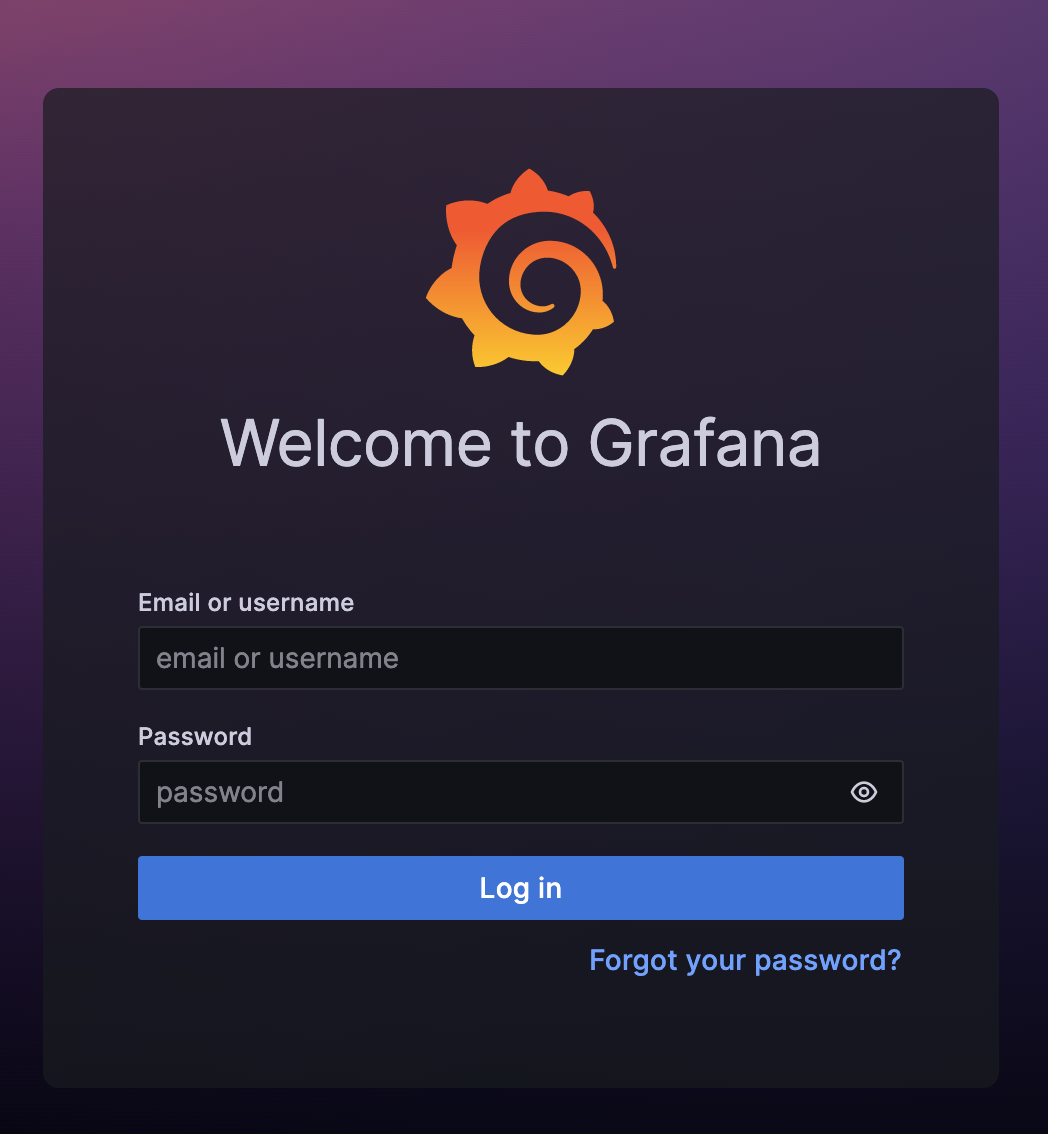
You can use the below credentials for logging in.
Email or username –> admin
Password –> admin
The next screen, asks for setting a new password, you can set a new password or continue with the above password, as shown below:
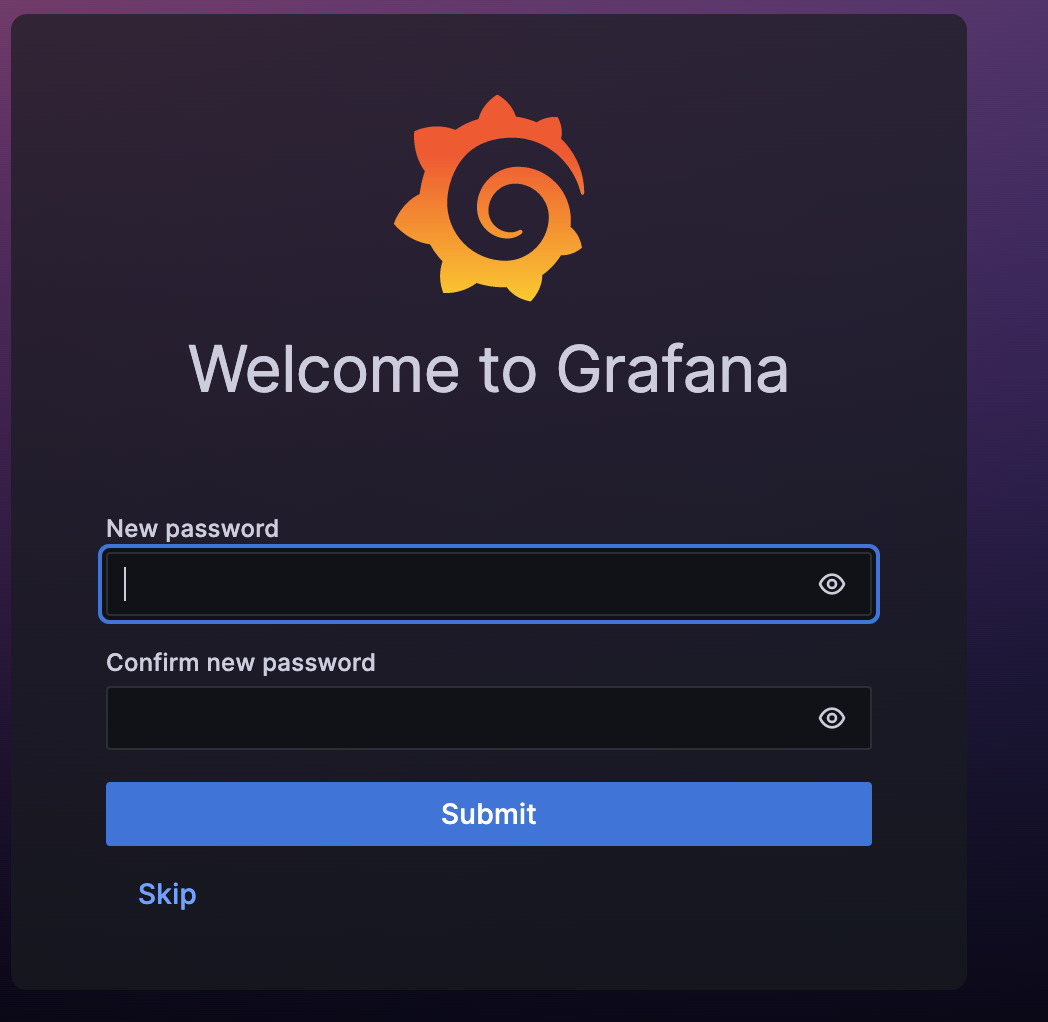
Click –> Submit
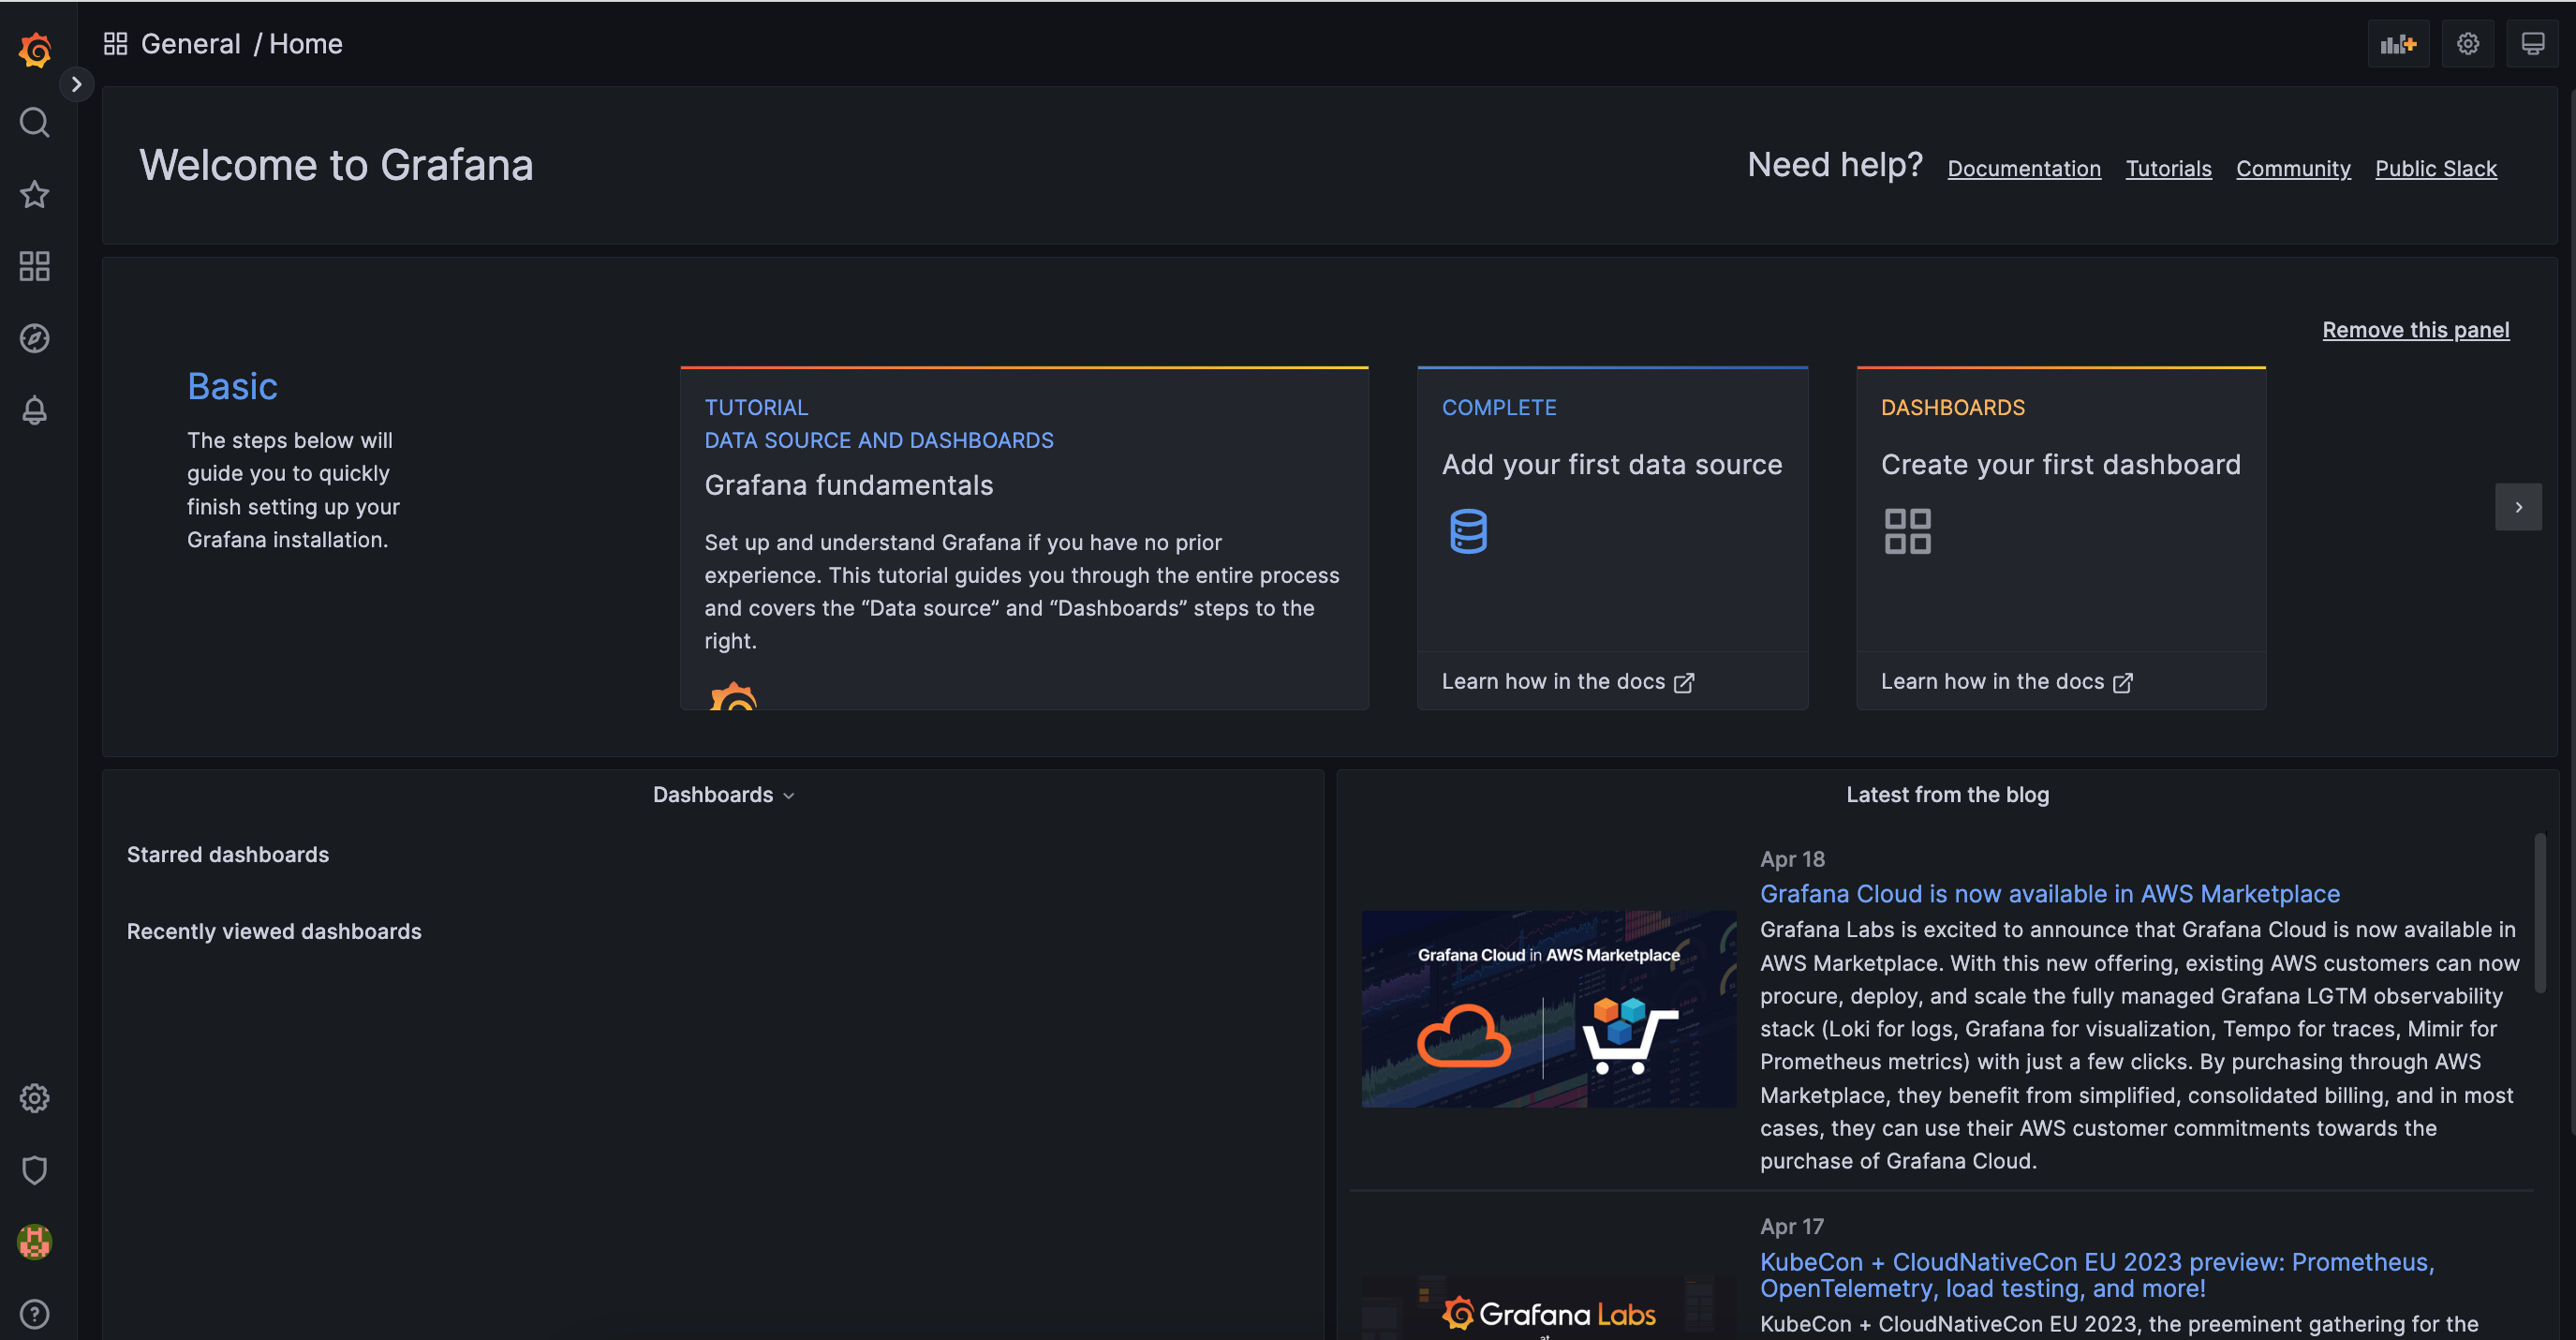
This will bring you to the Grafana Homepage
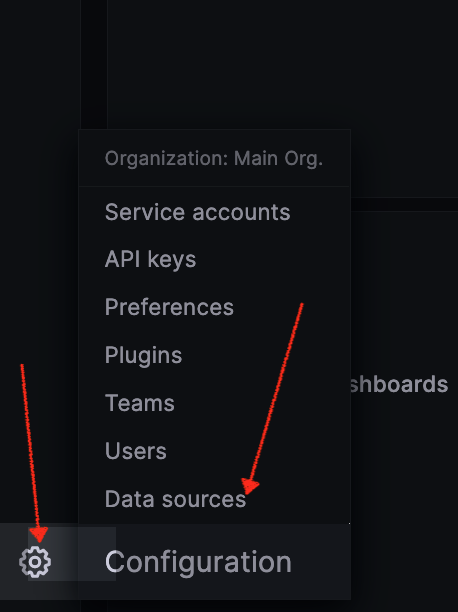
Next, click on the configuration icon below.
Configuration –> Data sources
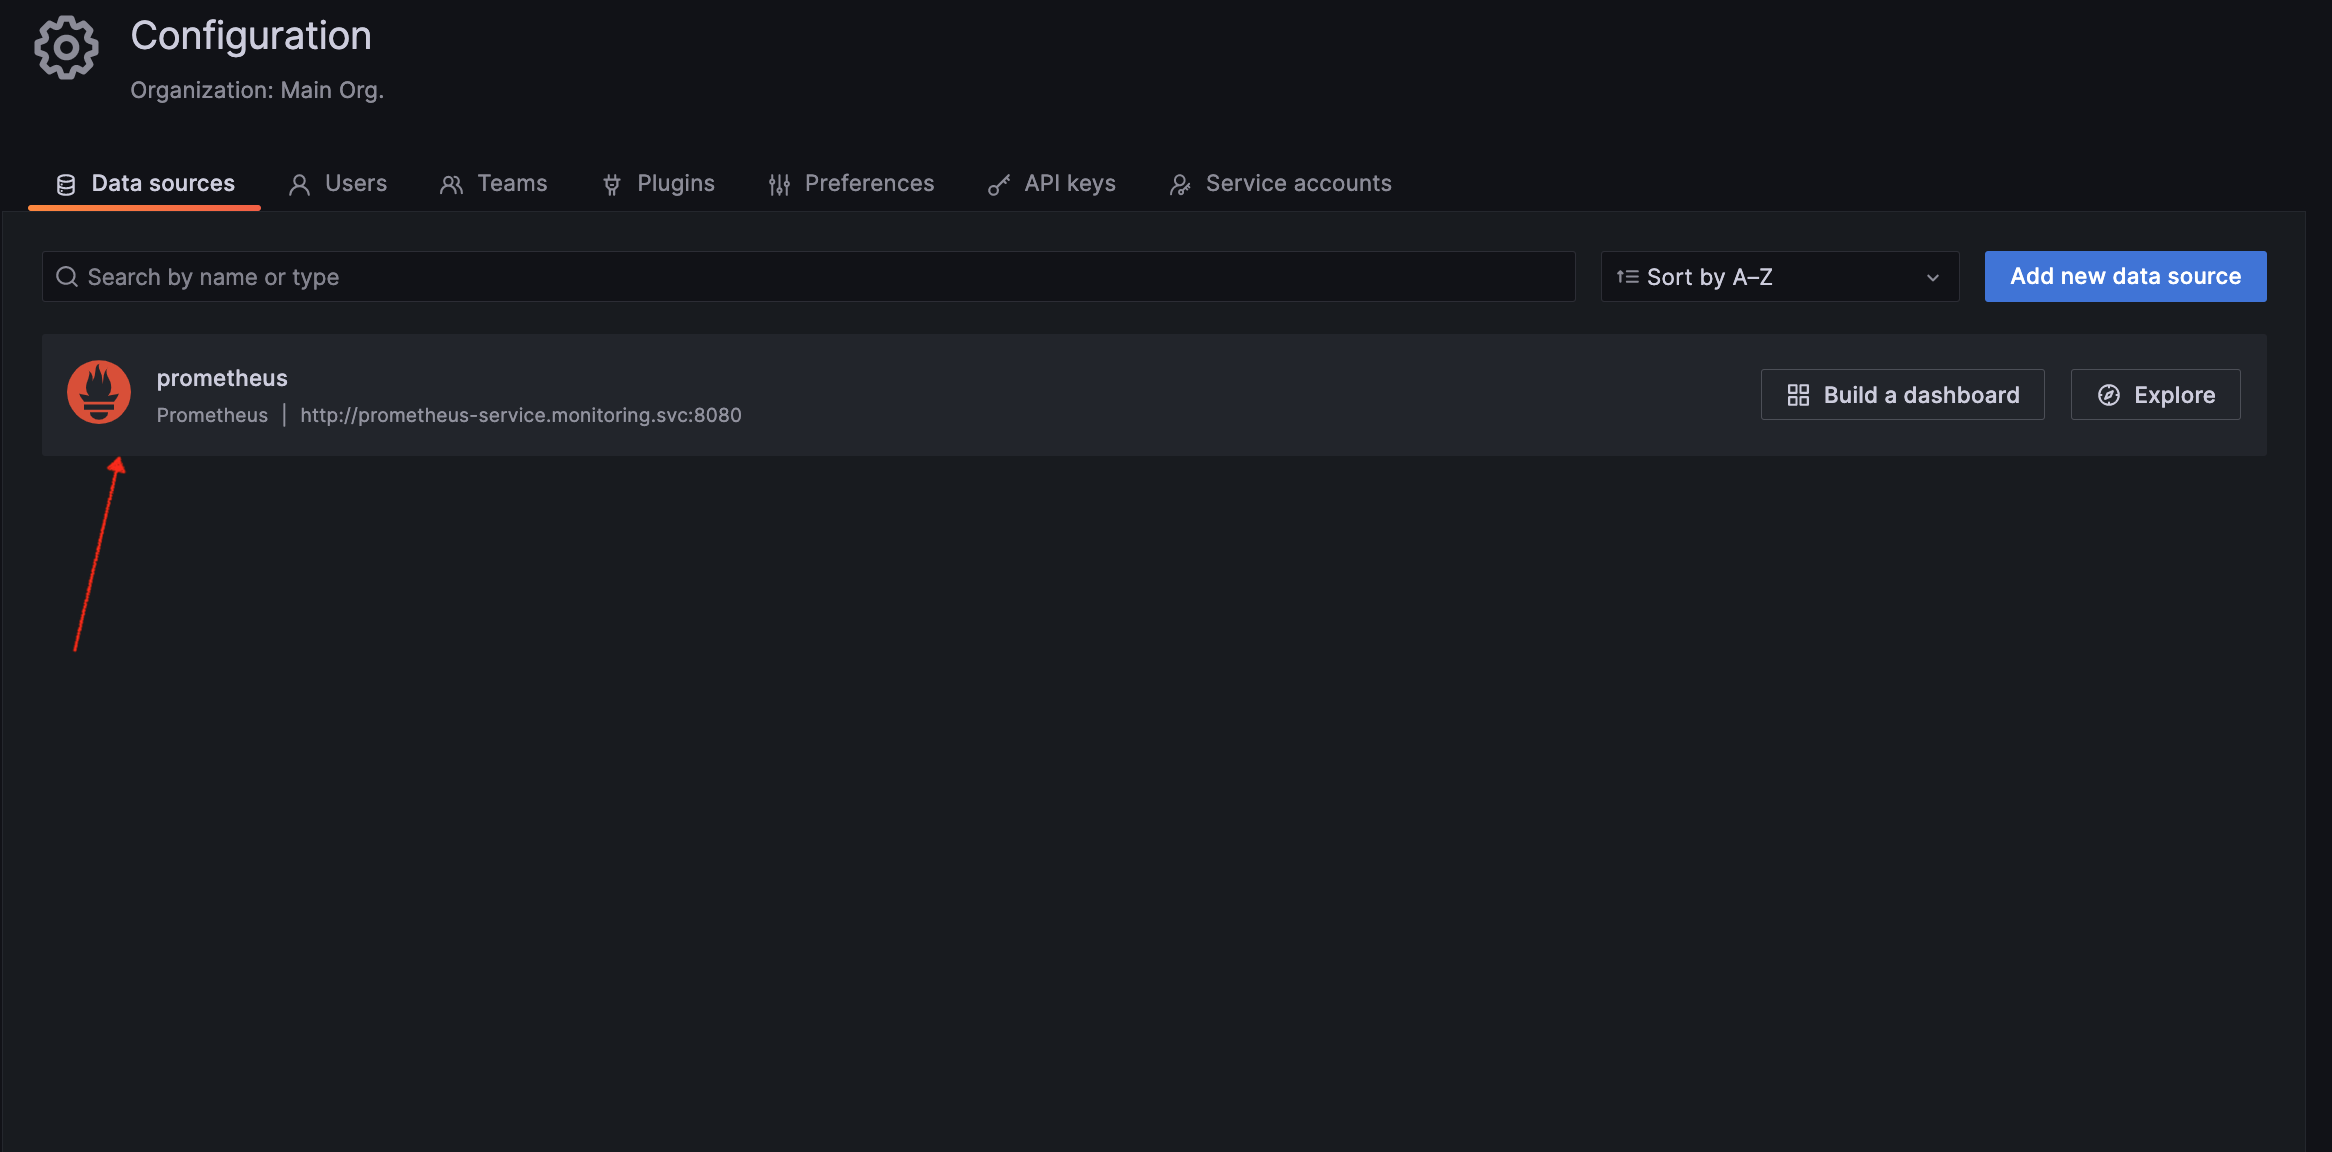
This brings up the configuration screen.
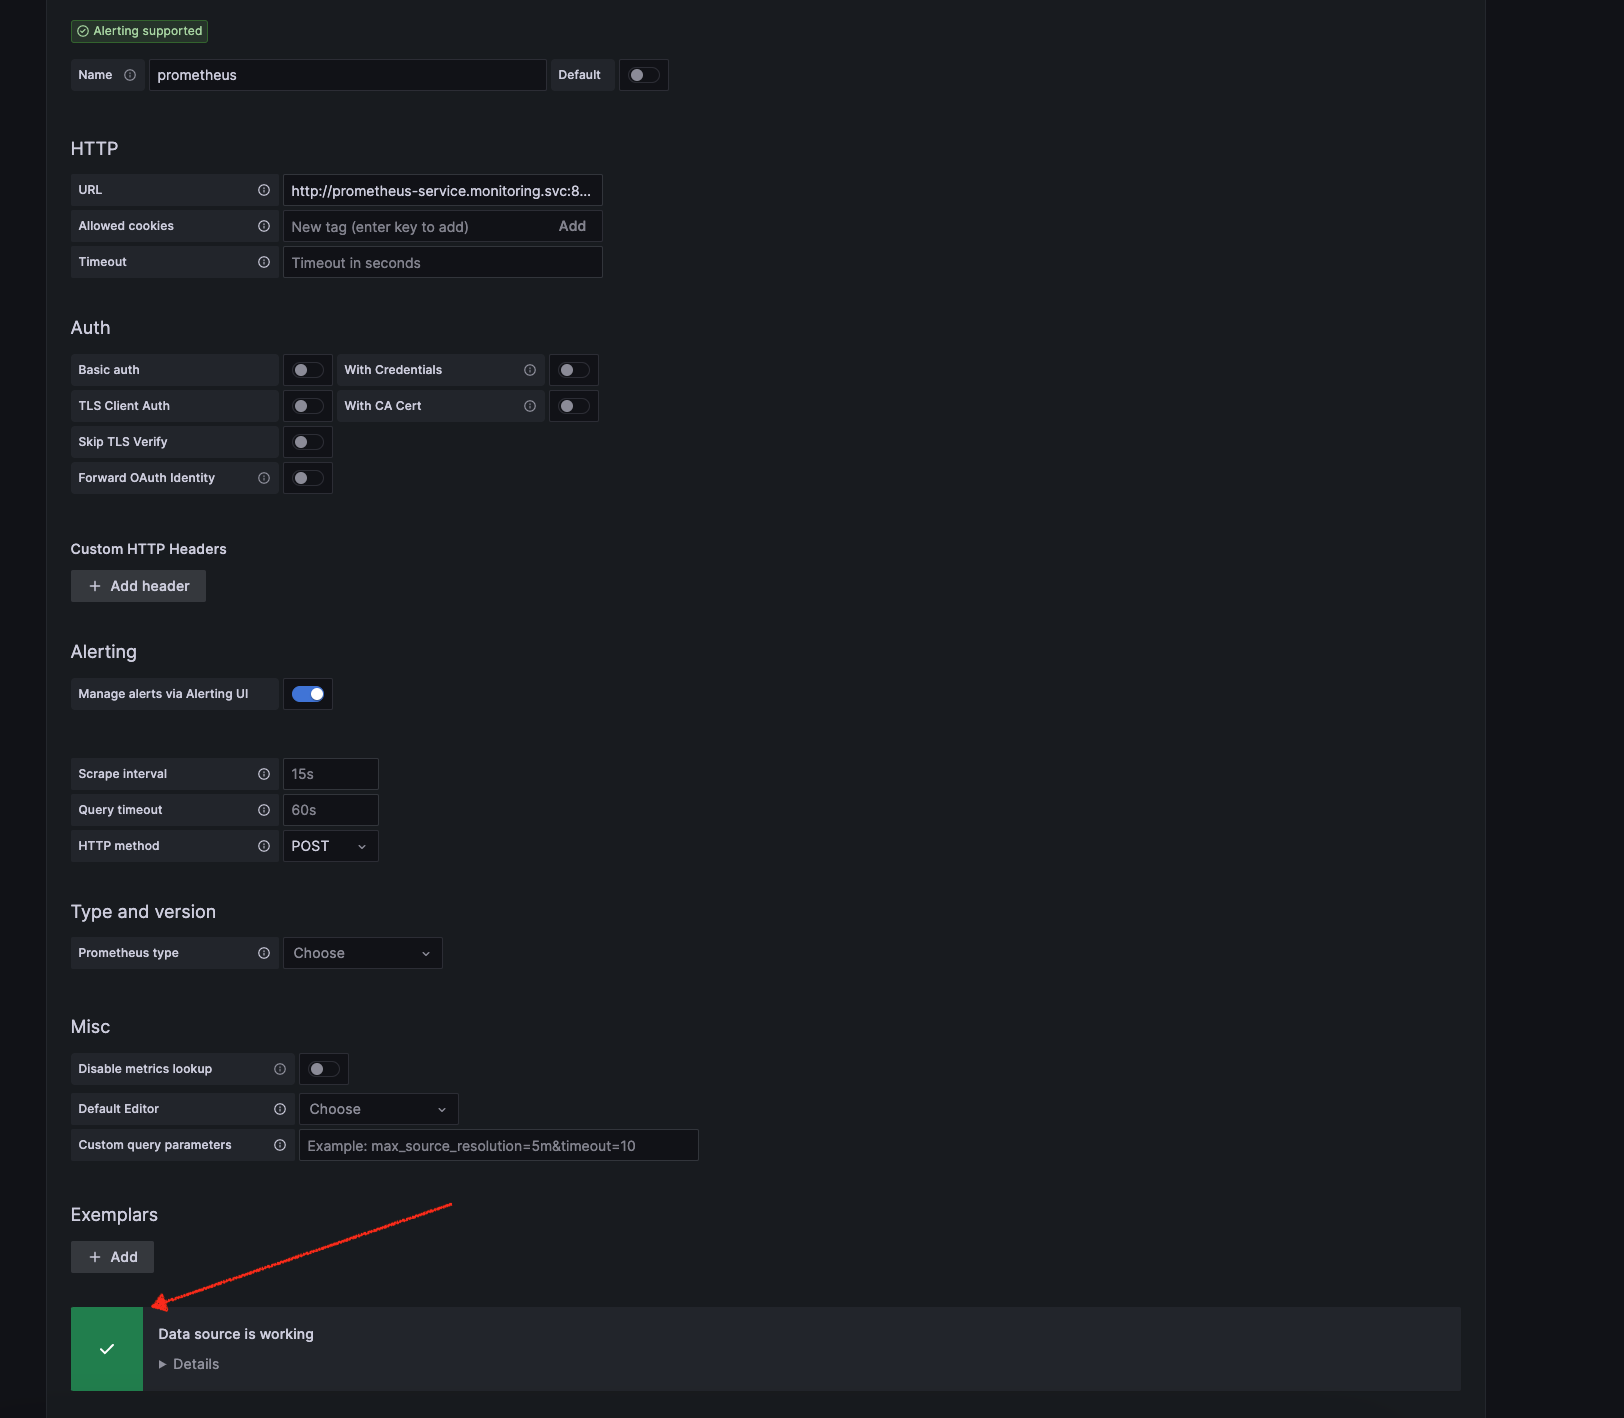
Click the Prometheus –> Data source
Click Save and test
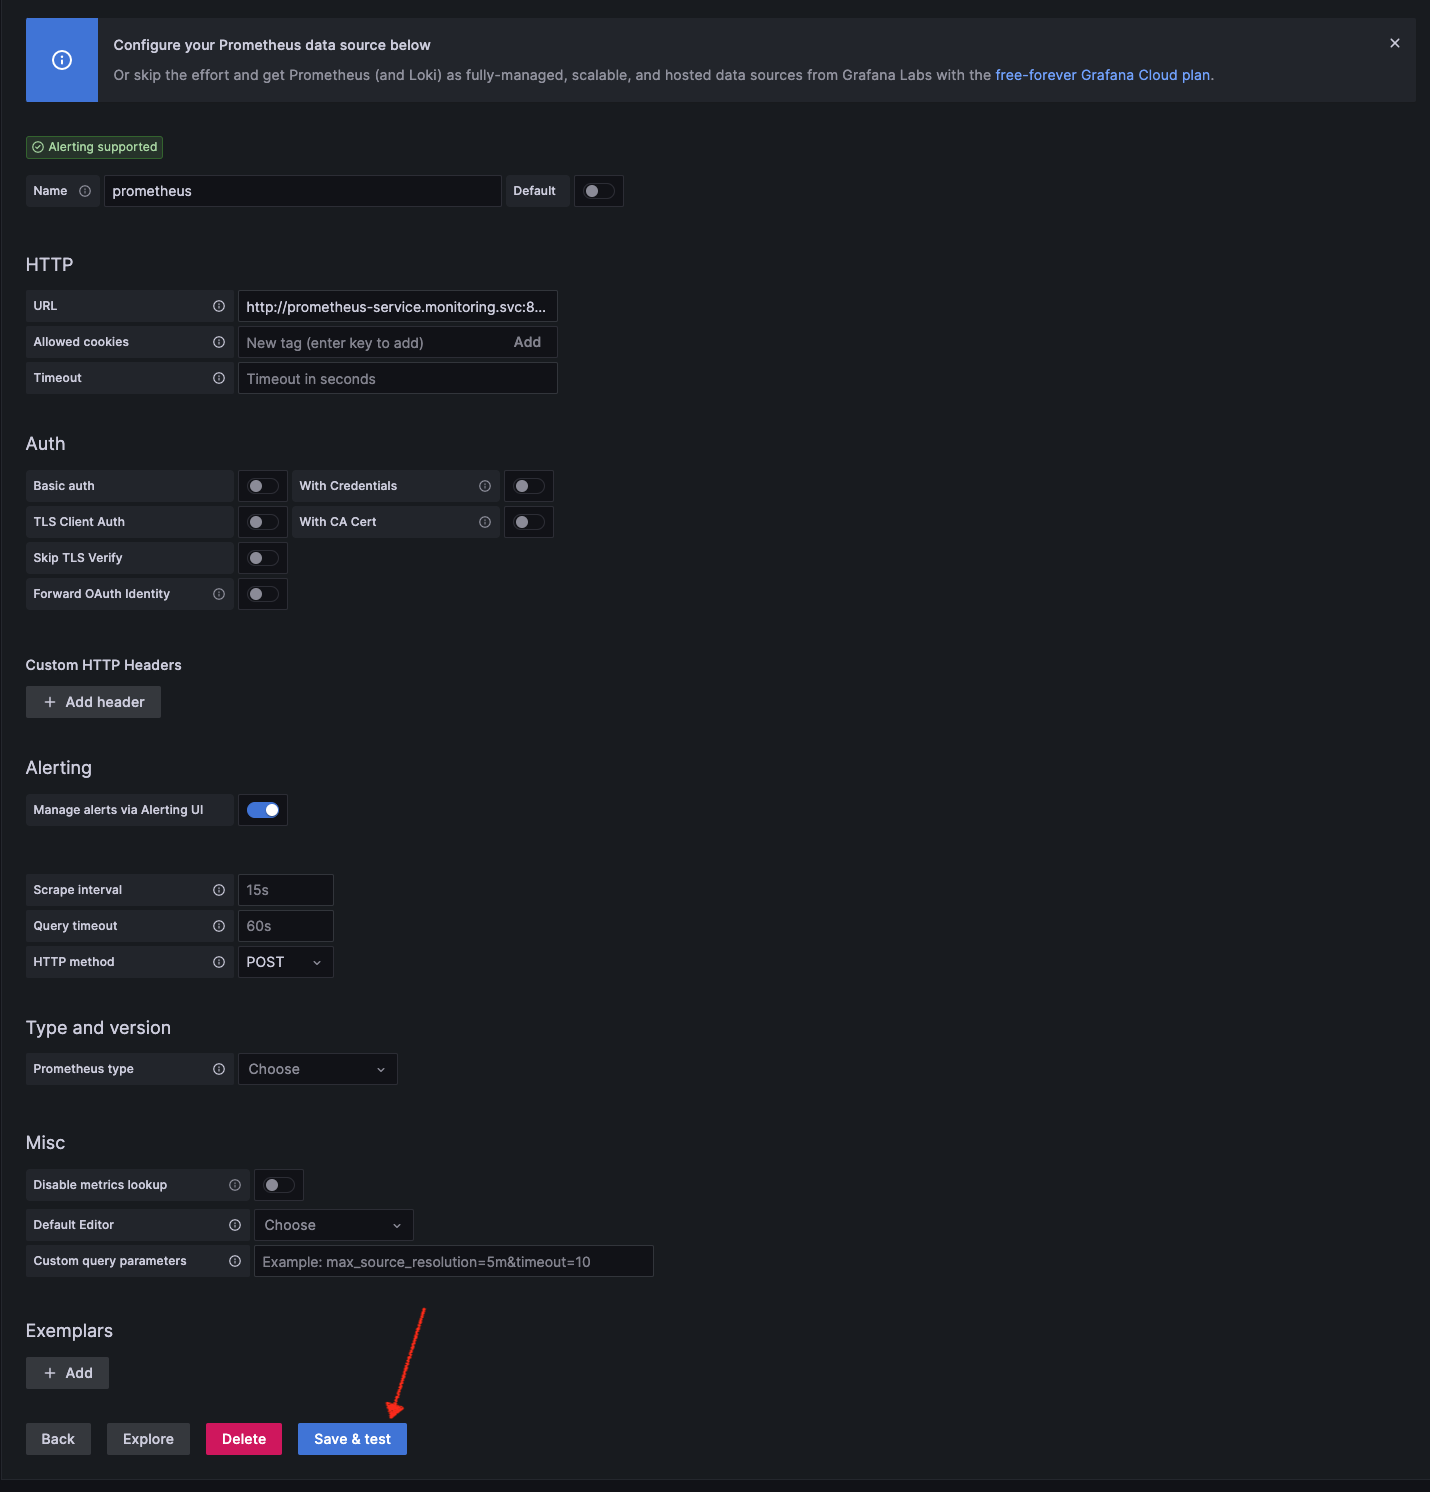
If everything is OK, then you should get the below screen.
Now you can add Dashboards to view your Kubernetes cluster
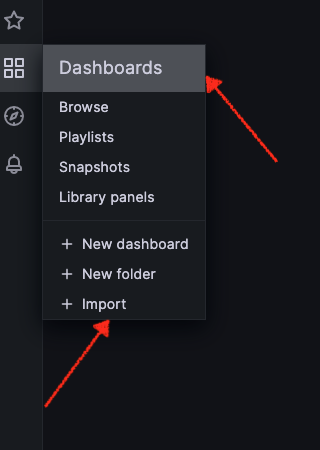
Dashboards –> Import
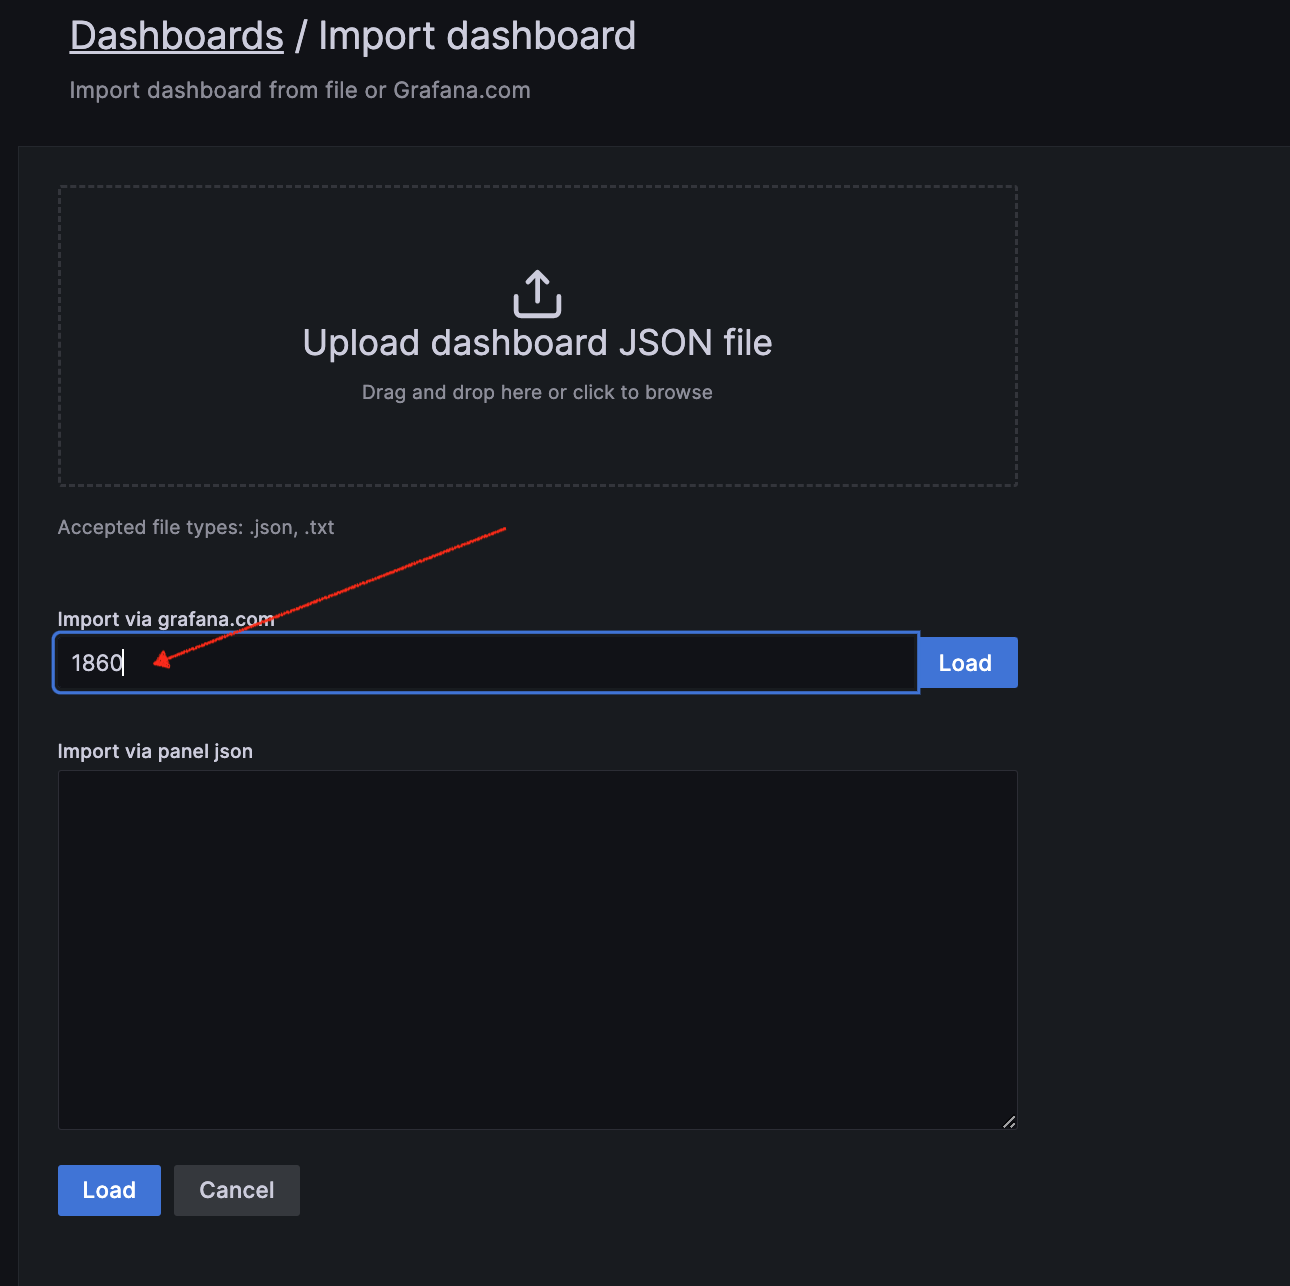
You can search for Dashboards from the below link:
https://grafana.com/grafana/dashboards/
We have selected a Dashboard ID = 1860 from Grafana. Insert this ID and Load
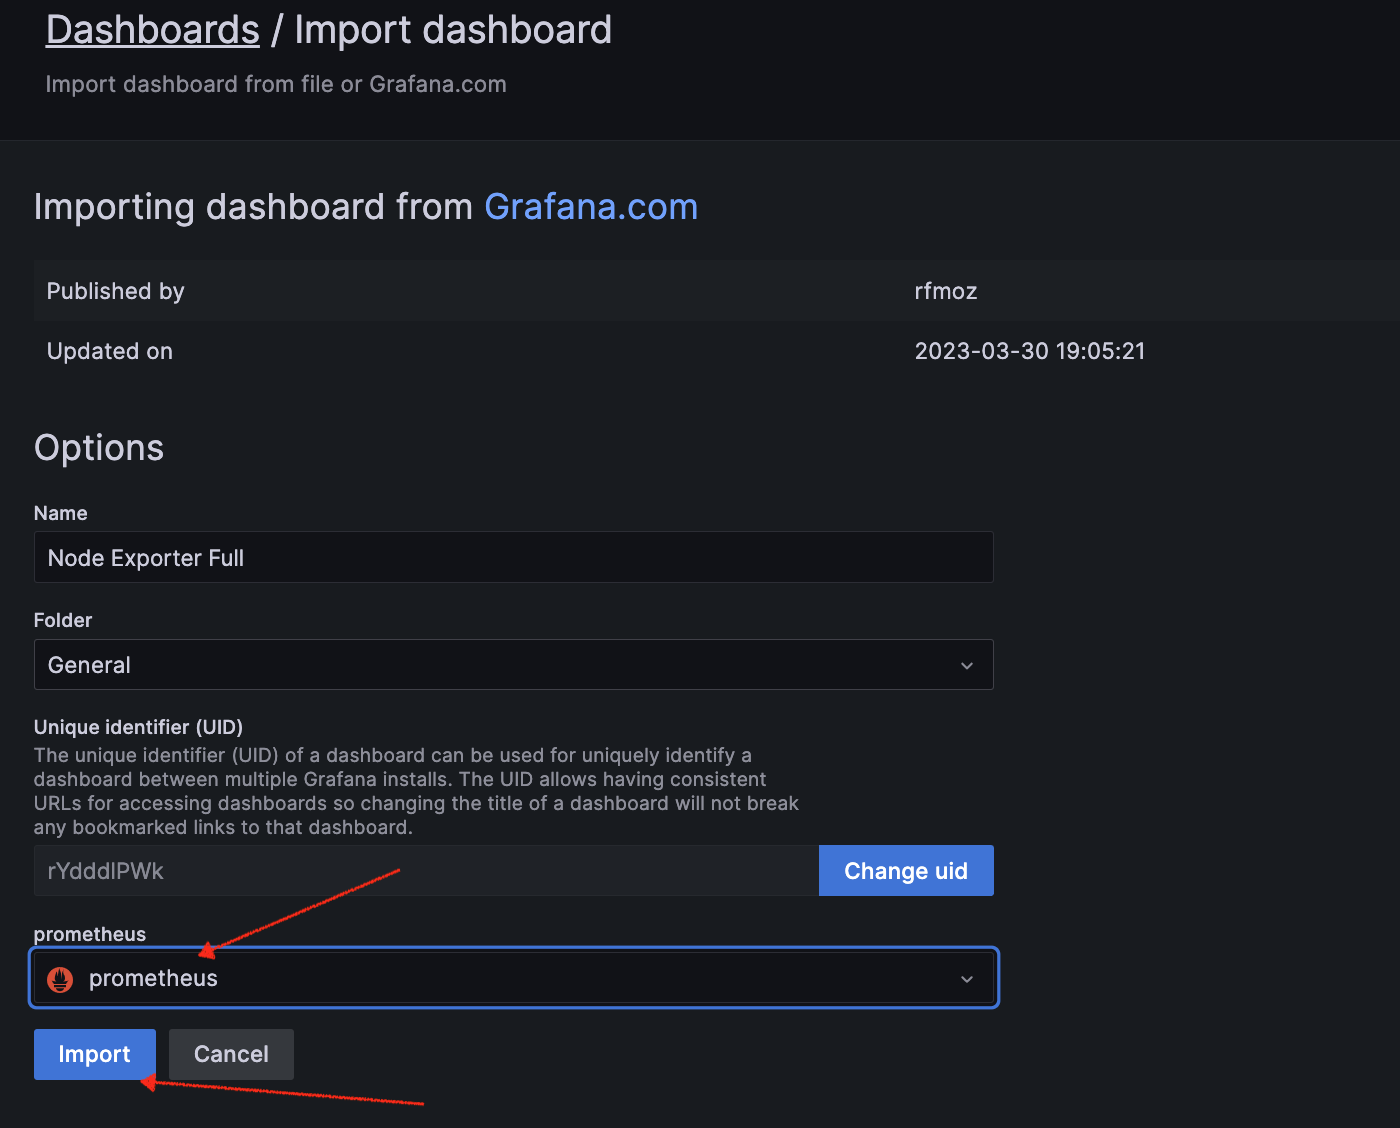
Next, import the Dashboard. Ensure that you select Prometheus as the Data source and click on Import
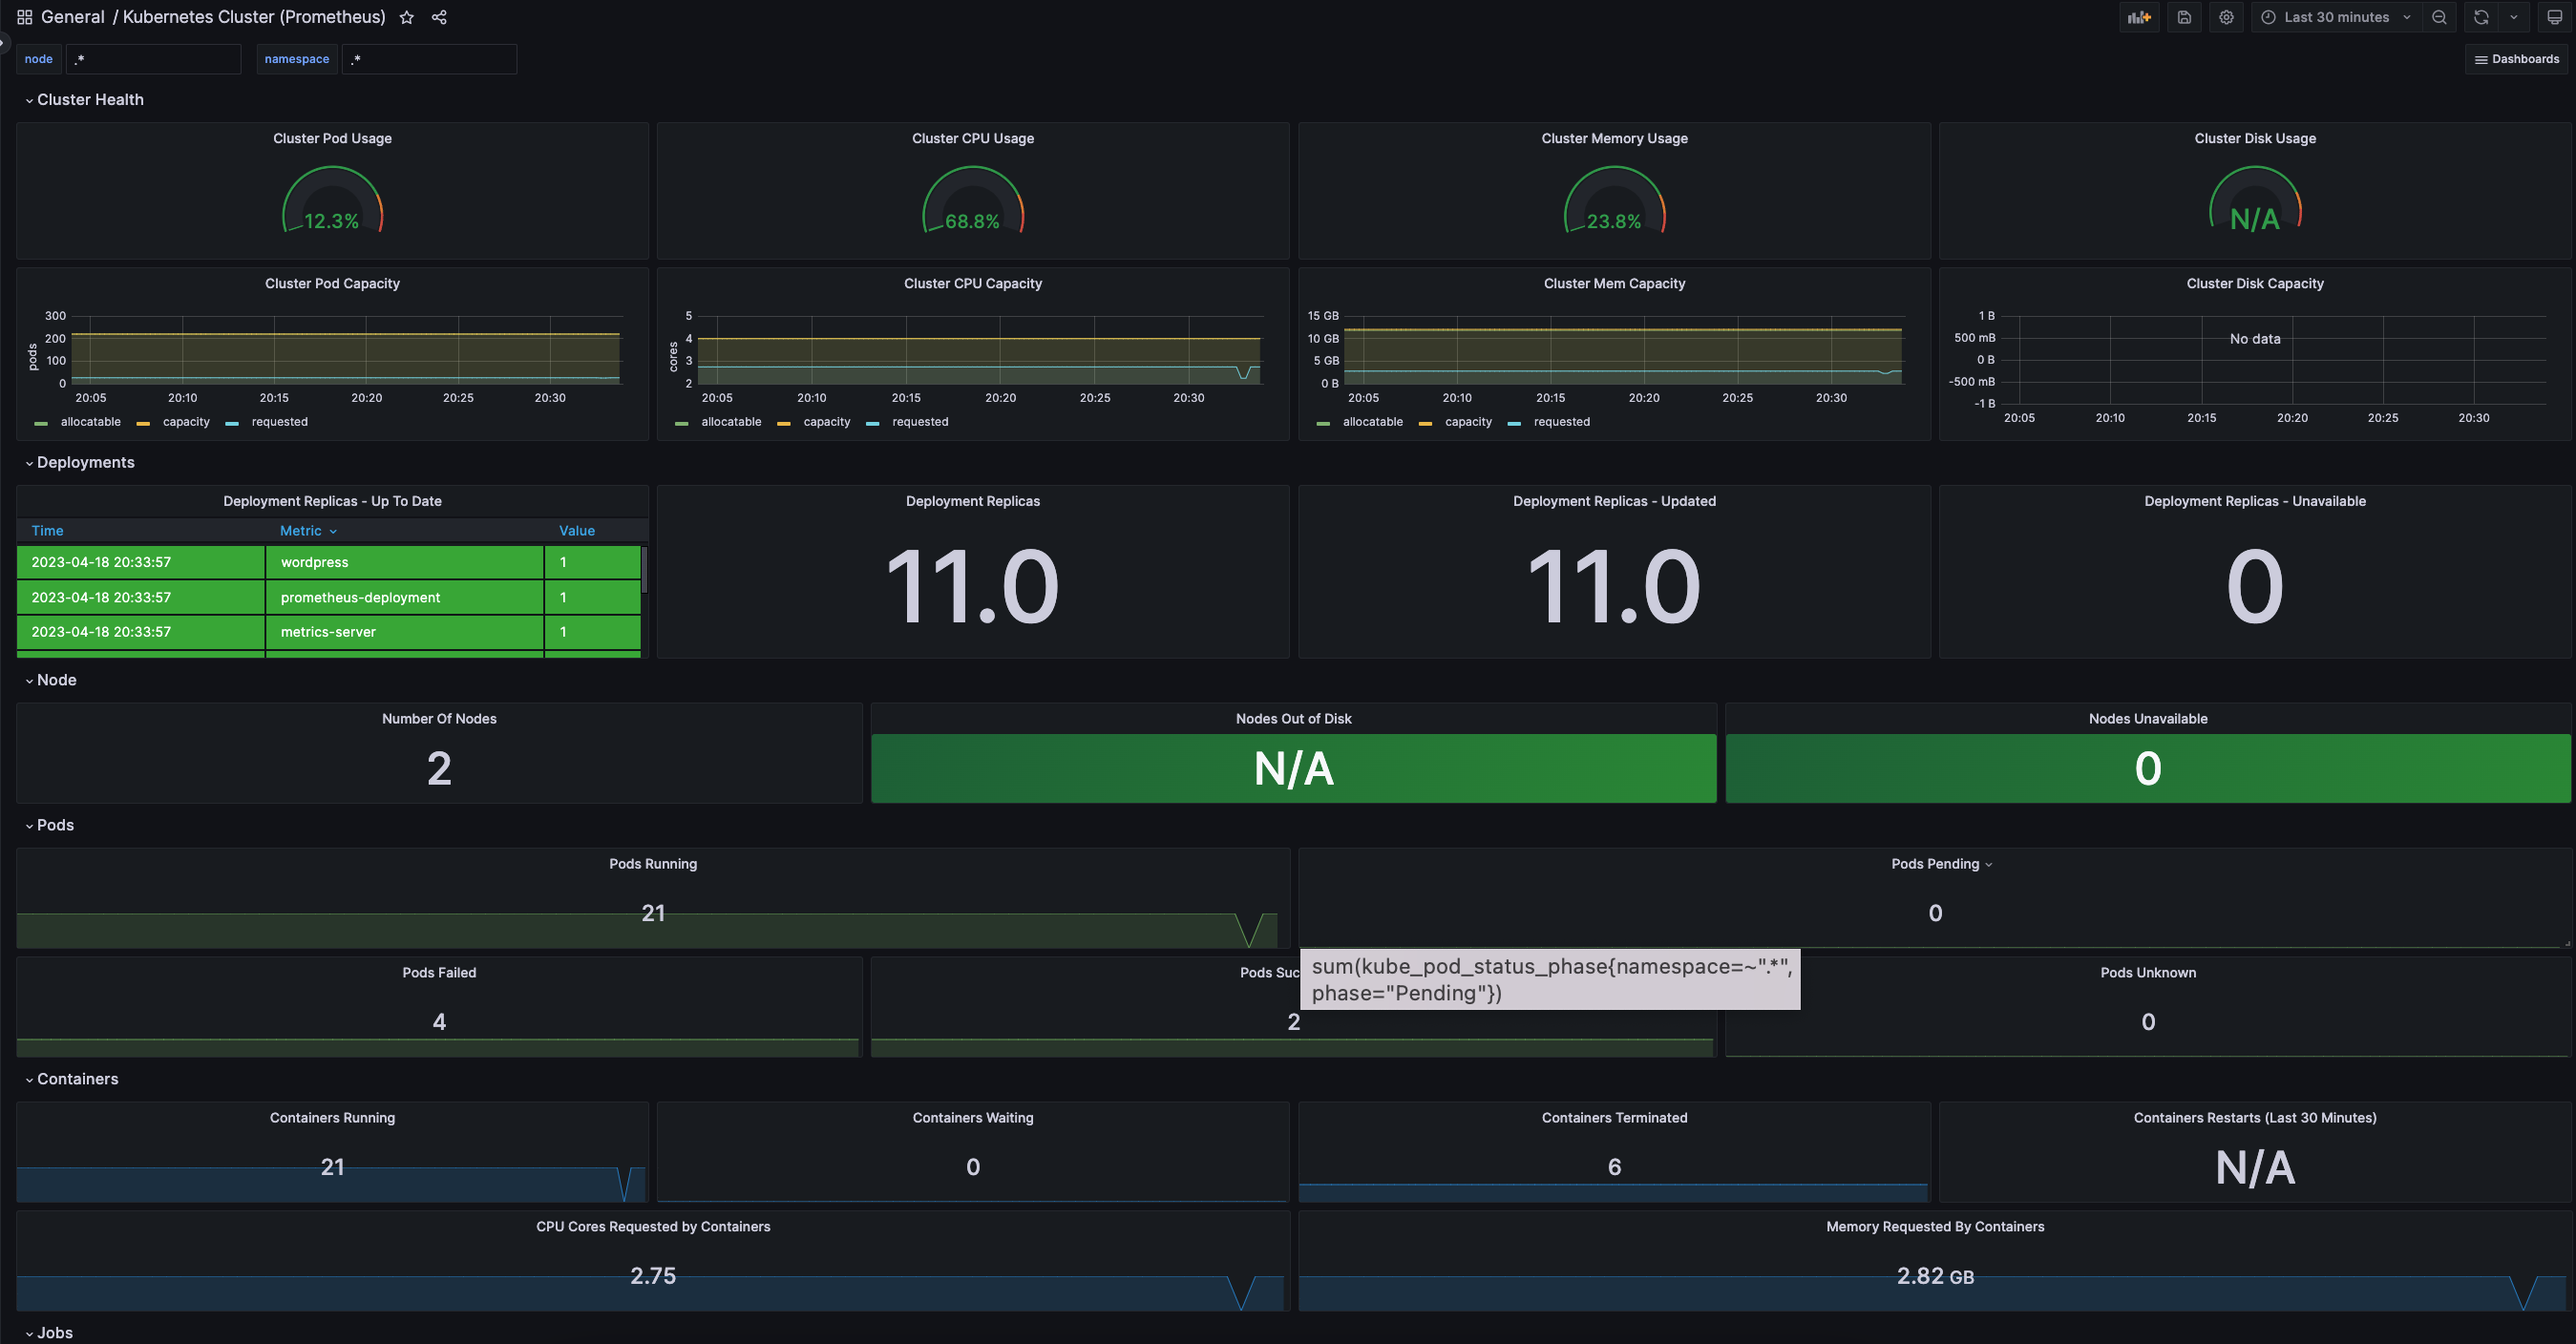
Based on your Dashboard ID and your requirements, import the appropriate dashboard to monitor your Kubernetes cluster. Below is a screenshot of the Grafana dashboard.
Congratulations !!! You have successfully set up monitoring on your Kubernetes cluster, by installing metrics, Prometheus and Grafana.
Part 1–> Installing monitoring metrics on Kubernetes cluster.
Comments are closed.